Data Logger Policy and Guidelines
Background
Data loggers can be invaluable in regard to determining and documenting what is going on from a water temperature, light penetration, and dryness over a given period of time. Used effectively they are one of the most useful field tools we have at our disposal.
Data loggers can help determine whether water temperatures are conducive to specific species, identify thermal stresses and cold water contributions, show the impact of canopy loss, shoreline logging, and development, and identify if specific locations go intermittent or get dangerously low.
NFC has used data loggers successfully in several projects, obtaining data that would otherwise be difficult to ascertain or prove. This data has been used to show water temperatures stressful to coldwater species, seasonal intermittency issues, and the impact of streamside logging on water temperature.
Data loggers will be provided to chapters for specific projects on an as-needed basis. At times we will move loggers between chapters to fill temporary needs when inventory we already own is currently unused.
We track our logger inventory at the national level by model, serial number, current deployment, and next availability date.
goals and objectives
We have seen several data logger projects that did not have clear goals. Collecting data for the sake of collecting data benifits no one and takes up time and money. Before creating a data logging plan, clearly identify and document your goals. This includes what you are looking to learn, what you will do with the data you collect, and how you will mitigate any problems identified.
Once you have documented your goals and objectives, use them to devise a draft deployment plan. It is helpful to present both your goals and objects and plan to others so they can add value where applicable. NFC has many people who have been involved in data collection, take advantage of this.
deployment
When it comes to data collection, logger location is critical. In most cases, more than one logger will be required to fully understand what is going on. And exactly where a data logger is deployed is important.
When testing for water temperature and the potential impact on coldwater species, it is important to use several loggers over a length of stream to make sure you are not missing any thermal refuges. Rarely is a single logger going to tell you what you need to know.
When trying to identify thermal stressors, loggers should be placed immediately upstream and downstream of impoundments, tributaries, canopy loss, logged areas, and other potential sources. Loggers placed in an impacted area provide very little useful information, and if you go too far downstream or upstream of the source your data could be impacted by things such as instream springs.
Using loggers that test for temperature and light penetration can help demonstrate the correlation between canopy loss, regardless of cause, and water temperature. The impact of light penetration in regard to impounded areas is obvious and not something you need to test for.
When looking for whether a stream goes intermittent at certain times, it is important that you place your logger in the deepest point within a section of water. that would not be subject to pooling. In many cases, streams that experience intermittency may still maintain small pools.
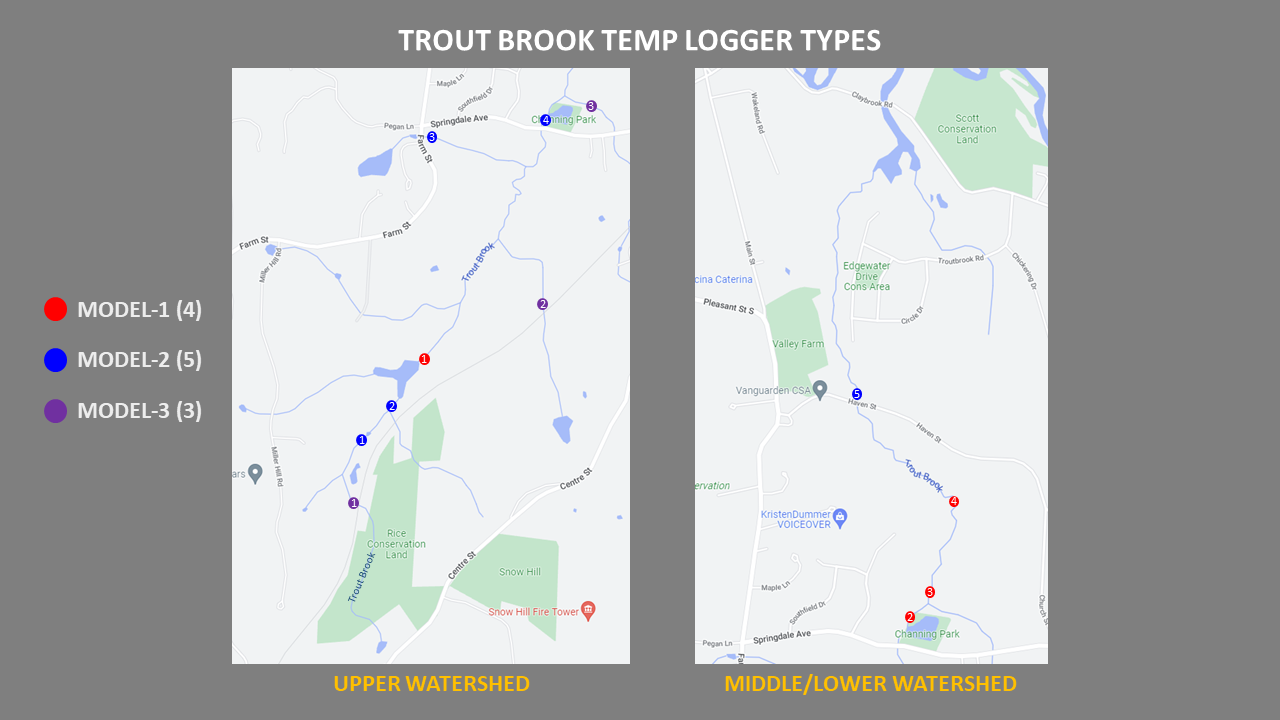
It is helpful to create a map of where loggers are deployed. Noting the type can help as well. This can be used in presentations to help people understand what you are doing and where.
equipment
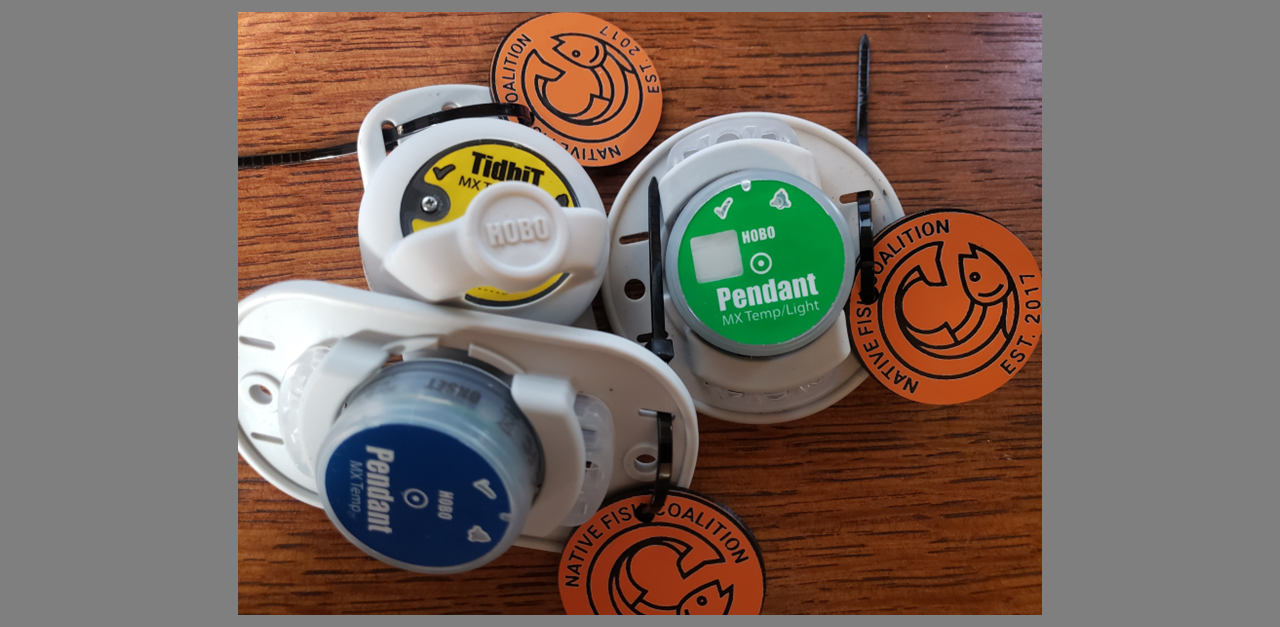
NFC prefers to use data loggers made by HOBO. They have a proven track record and are used by many organizations and agencies. To date we have used their 2201, 2202, and 2203 model data loggers.
The 2201 records water temperature only, the 2202 records temperature and light penetration, and the 2203 records temperature and dryness. They cost roughly $75, $100, and %150 respectively. NFC has several sources we buy from based on availability and cost.
Each function adds to the cost of a data logger. The more expensive the logger, the more financial cost and exposure we have. Select data loggers based on need, and do not exceed what is required to get the job done.
Data loggers can be lost to theft, vandalism (pulled and thrown in the woods), lost or damaged due to high water and debris, and even lost during deployment and removal.
To date, NFC has lost 3 data loggers. One was apparently stolen, one was either stolen, vandalized, or lost during retrieval, and one was lost to a high water event.
placement
Data loggers should be placed in a manner where they are protected from floating debris, animals, anglers, and high water. It is best to place loggers immediately downstream of rocks or under the downstream side of overhanging rocks to protect them.
Data loggers can be deployed using j-hooks made from bent rebar. Logger should be attached to the j-hook with a heavy-duty electric tie. Unless theft or vandalism is a real concern, the top of the rebar can be painted orange for easy identification. NFC has had success using welded tabs on the rebar to help prevent loggers from sliding off.
Cement blocks can be used for deploying data loggers where the bottom is too rocky to penetrate or where the mud is too deep to effectively use a j-hook. The logger should be attached to the block using heavy-duty electric ties, cable, or wire.
In deep slow water, a rope tied to the shore can help locate data loggers after initial deployment. And in all cases, recording the GIS location is helpful in regard to retrieval and reporting.
labeling
NFC believes that labelling data loggers helps deter theft or vandalism. It gives them a level of formal ownership that could deter theft and vandalism. It also gives the public a source to contact if they have any questions.
NFC has procured highly visible easy to read logoed vinyl tags with holes for affixing to data loggers. We will make them available to any chapter that is interested.
recording frequency
While many loggers are set-up to record data every 15 minutes, this is excessive and unnecessary. Not only will this decrease battery life, but it will also make identifying problems tougher as the graph lines become fuzzy. NFC recommend that you record hourly. In some cases, you may be able to get away with less.
set-up and maintenance
Data loggers must be reset, or reconfigured, after each use. This can be done via the HOBO app. Once the data has been downloaded, you must reset the logger so it starts fresh next time it is deployed. Loggers should also be turned off when not in use. Conversely, they need to be turned on when they are redeployed.
Data logger battery life is long, but not indefinite. Battery strength should be checked before deployment. If the battery needs to be changed, the chapter should do so and national NFC will reimburse them.
It is also important to note that as long as they are on, loggers will continue to record data. If they run out of storage, they will overlay the oldest data.
Please do not override the serial number or apply any project or location specific names. It is safest to work with the default serial numbers and connect it to a specific location in a spreadsheet and/or map.
As NFC has learned, it is best to check your data loggers at least once a month. In some cases we have found loggers thrown up on the bank by someone, pushed up out of the water by vegetation growth, and left dry by receding water due to placement.
dowloading data
In order to protect yourself from complete data loss due to theft, loss, or damage, logger data should be downloaded at least once a month. This can be done in conjunction with the general monitoring. Failing to do so can result in the loss of an entire season worth of data and set projects back a year or more.
presenting data
Data collected from loggers should be downloaded to an Excel spreadsheet. While not the best way to present data, it is a great way to look for things that are not obvious or easily detected in graphic displays. Spreadsheets can also be used to feed graphs in PowerPoint.
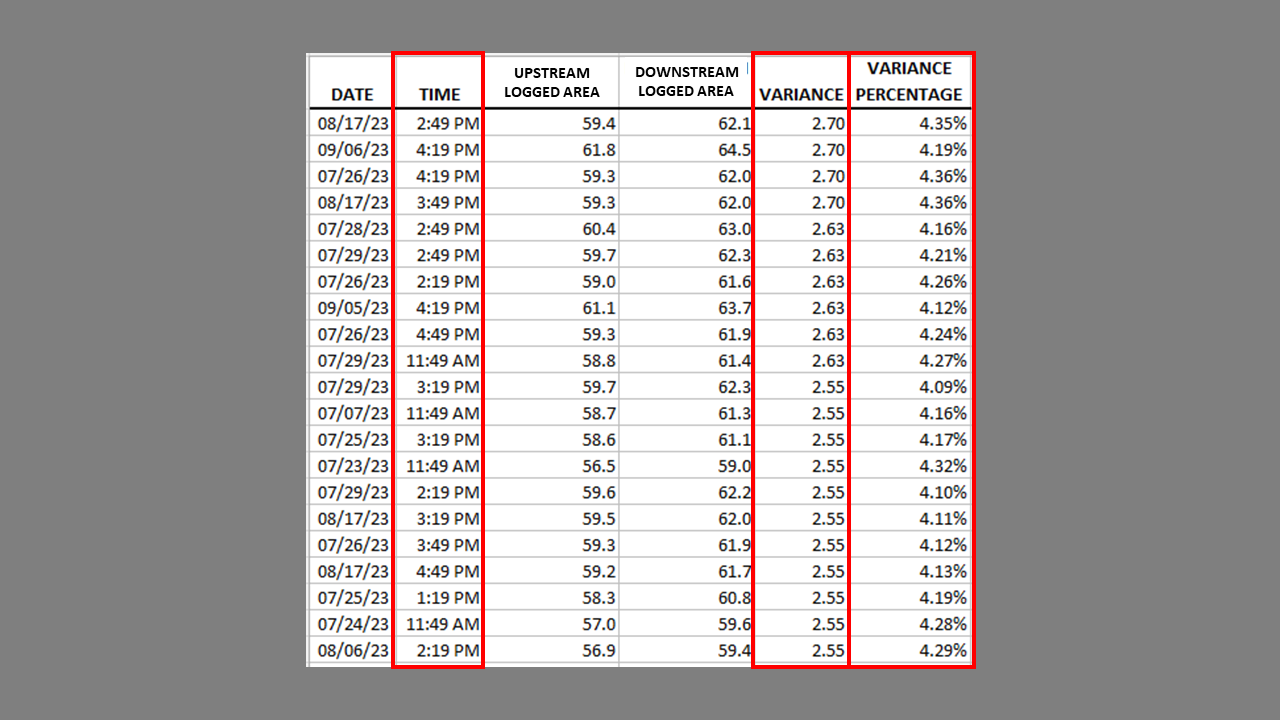
After failing to confirm that streamside logging was negatively impacting water temperature via graphs, NFC sorted the raw data, added a couple of columns that calculated variances between loggers upstream and downstream of the cut area, and showed that the water was warming 2-3 degrees in the cut area mid afternoom when the sun was high.
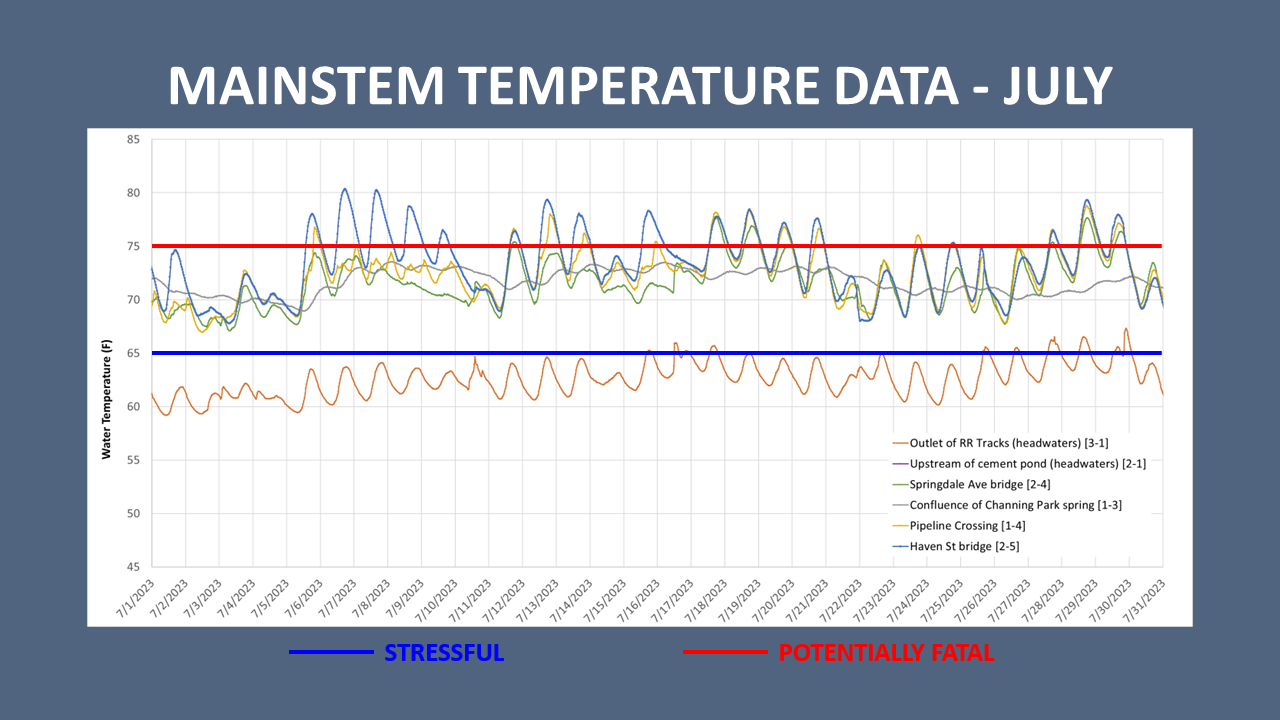
Data should be presented in line graph form at the individual logger level as well as all loggers related to the project together. Adding things like lines showing stressful and potentially fatal temperatures can be very helpful as well.
SUMMARY
Data logging can be invaluable. However, without a well thought out equipment, deployment, maintenance, and data extraction plan you can find yourself with incomplete and potentially misleading data, or worse, no date at all.
In one case, while NFC did not create the data logging plan, nor did we have any input, at the end of the season the data collected was not sufficient to determine and document the source of warming in a stream that had apparently lost its brook trout from one year to the next.
In another case, we lost an entire season of data collection over multiple loggers due to deployment issues and a less than needed maintenance and data extraction plan.


