Data Loggers
Background
When it comes to assessing conditions and overall stream health, water temperature is one of the most important factors. Ascertaining water temperature highs, lows, averages, trends, and spikes is critical to understanding what species of fish can and cannot live in the respective water. It can also help identify critically important thermal refuge as well as thermal stressors which might be able to be mitigated via streamside tree planting, wood loading, dam removal, etc.
When working in headwater streams and areas prone to low water or drought conditions, it is also important to understand whether sections of the stream go intermittent, or dry, and if so, are fish able to move to other sections of the stream for refuge. Comparing unusual spikes in water temperature with published outside air temperature can help identify intermittence and dryness. If testing specifically for intermittency, a specialized data logger can be used.
Goals
Collecting meaningful and complete datasets in regard to water temperature is not as easy as it sounds. In addition to monitoring temps for an entire season (spring through fall), it is critical that data loggers be deployed in a way that thermal stressors and thermal refuge can be identified and easily located. Failure to do so can result in incomplete datasets, misleading data, incorrect assumptions and recommendations, or worse, the need to do it again.
Approved Equipment
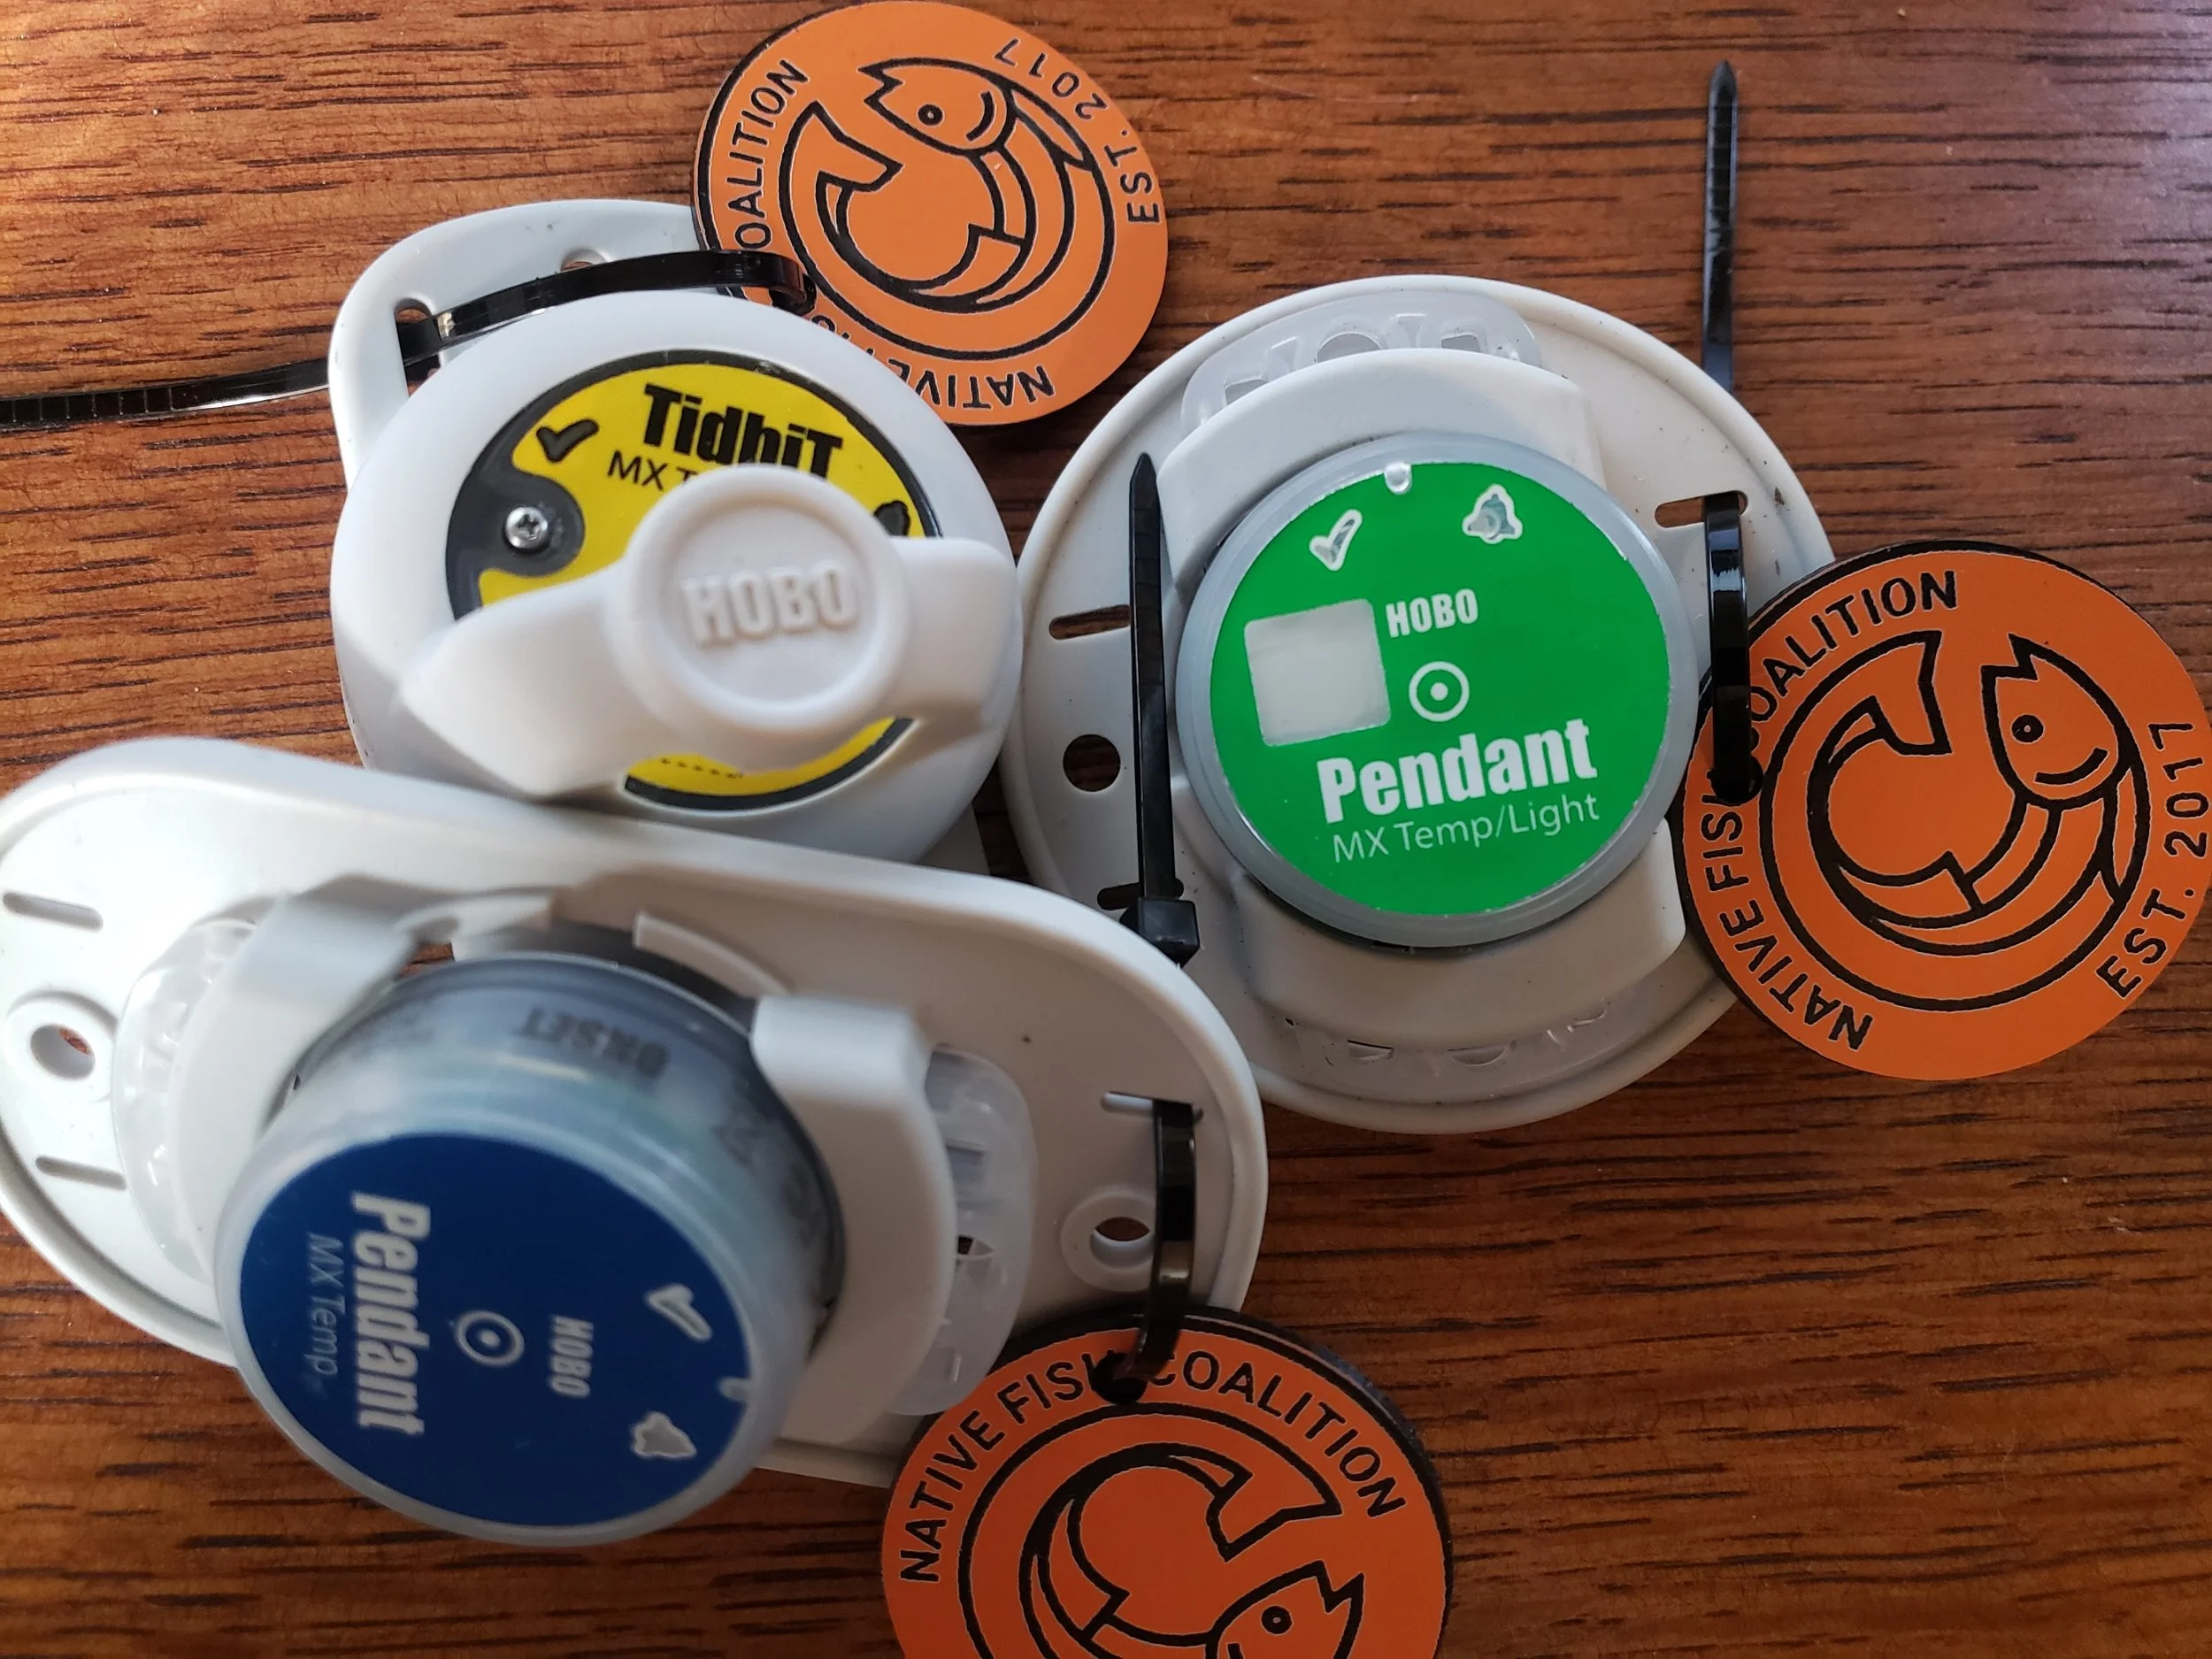
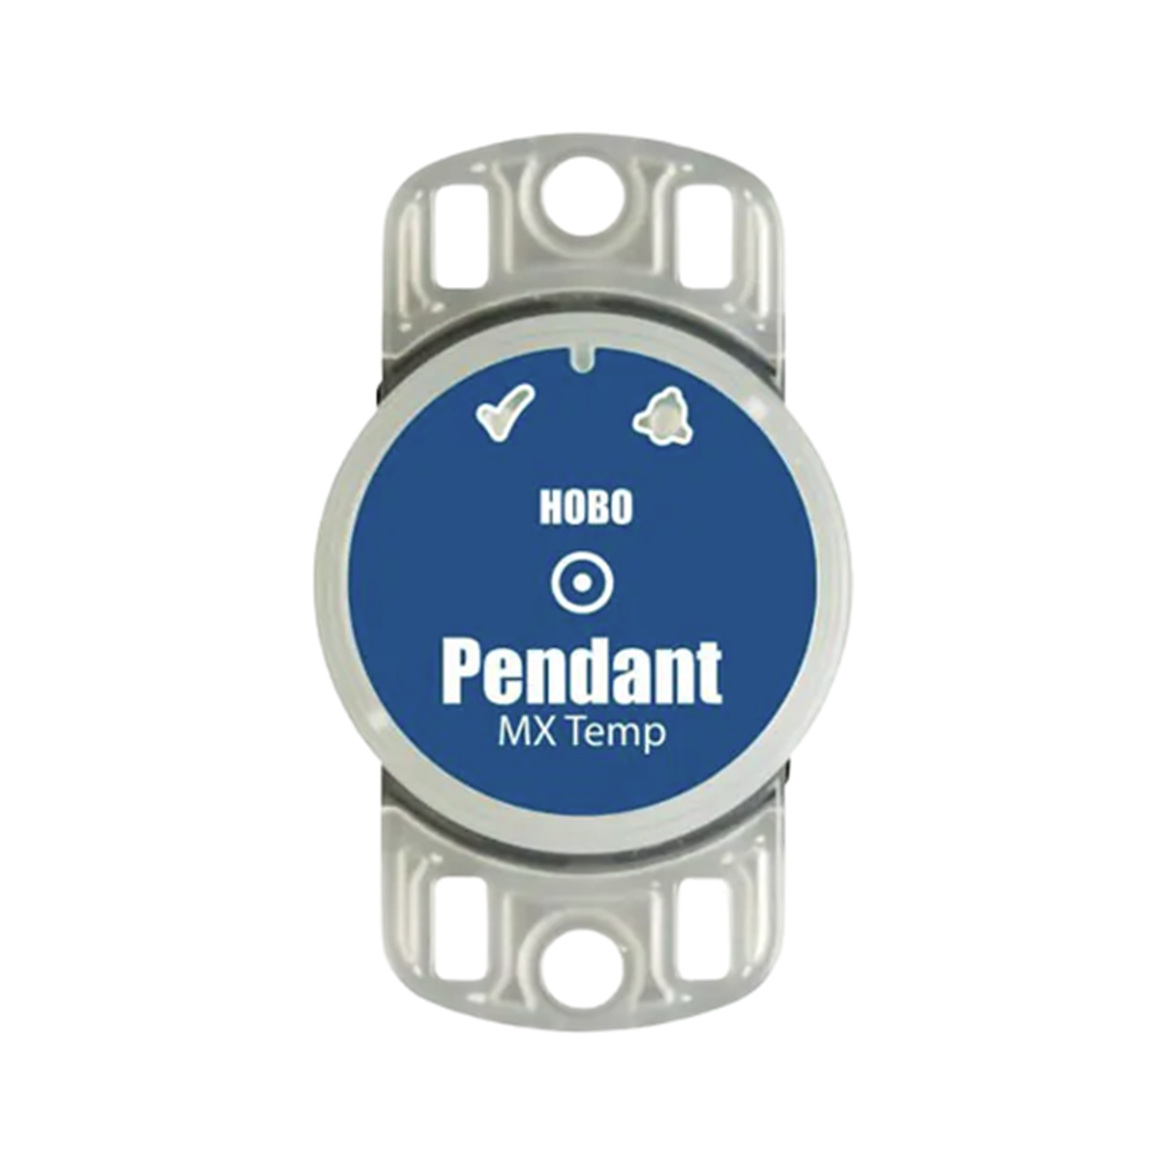
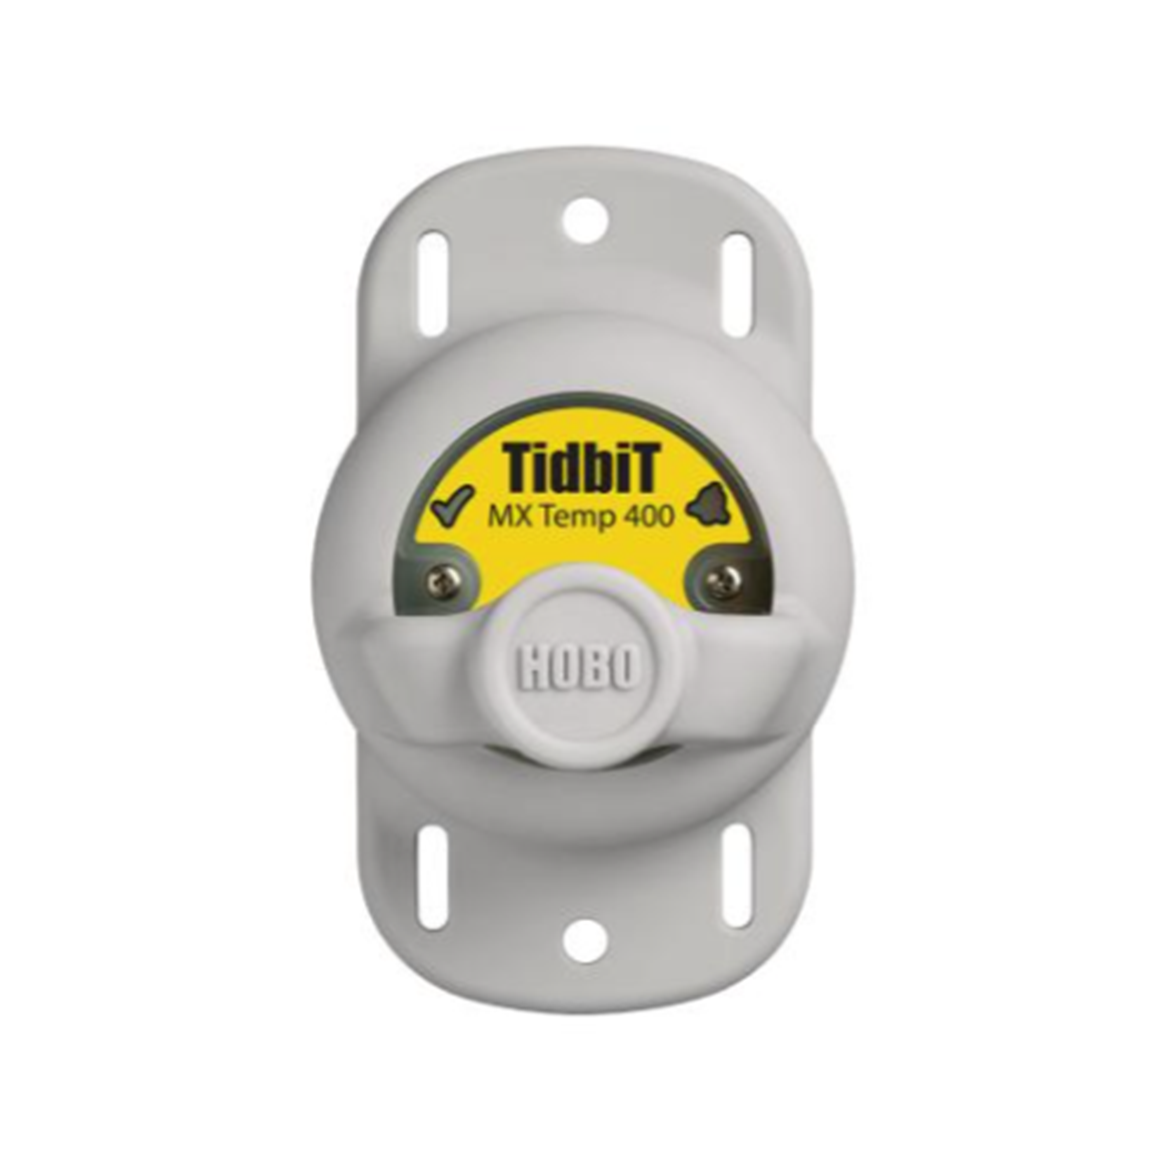
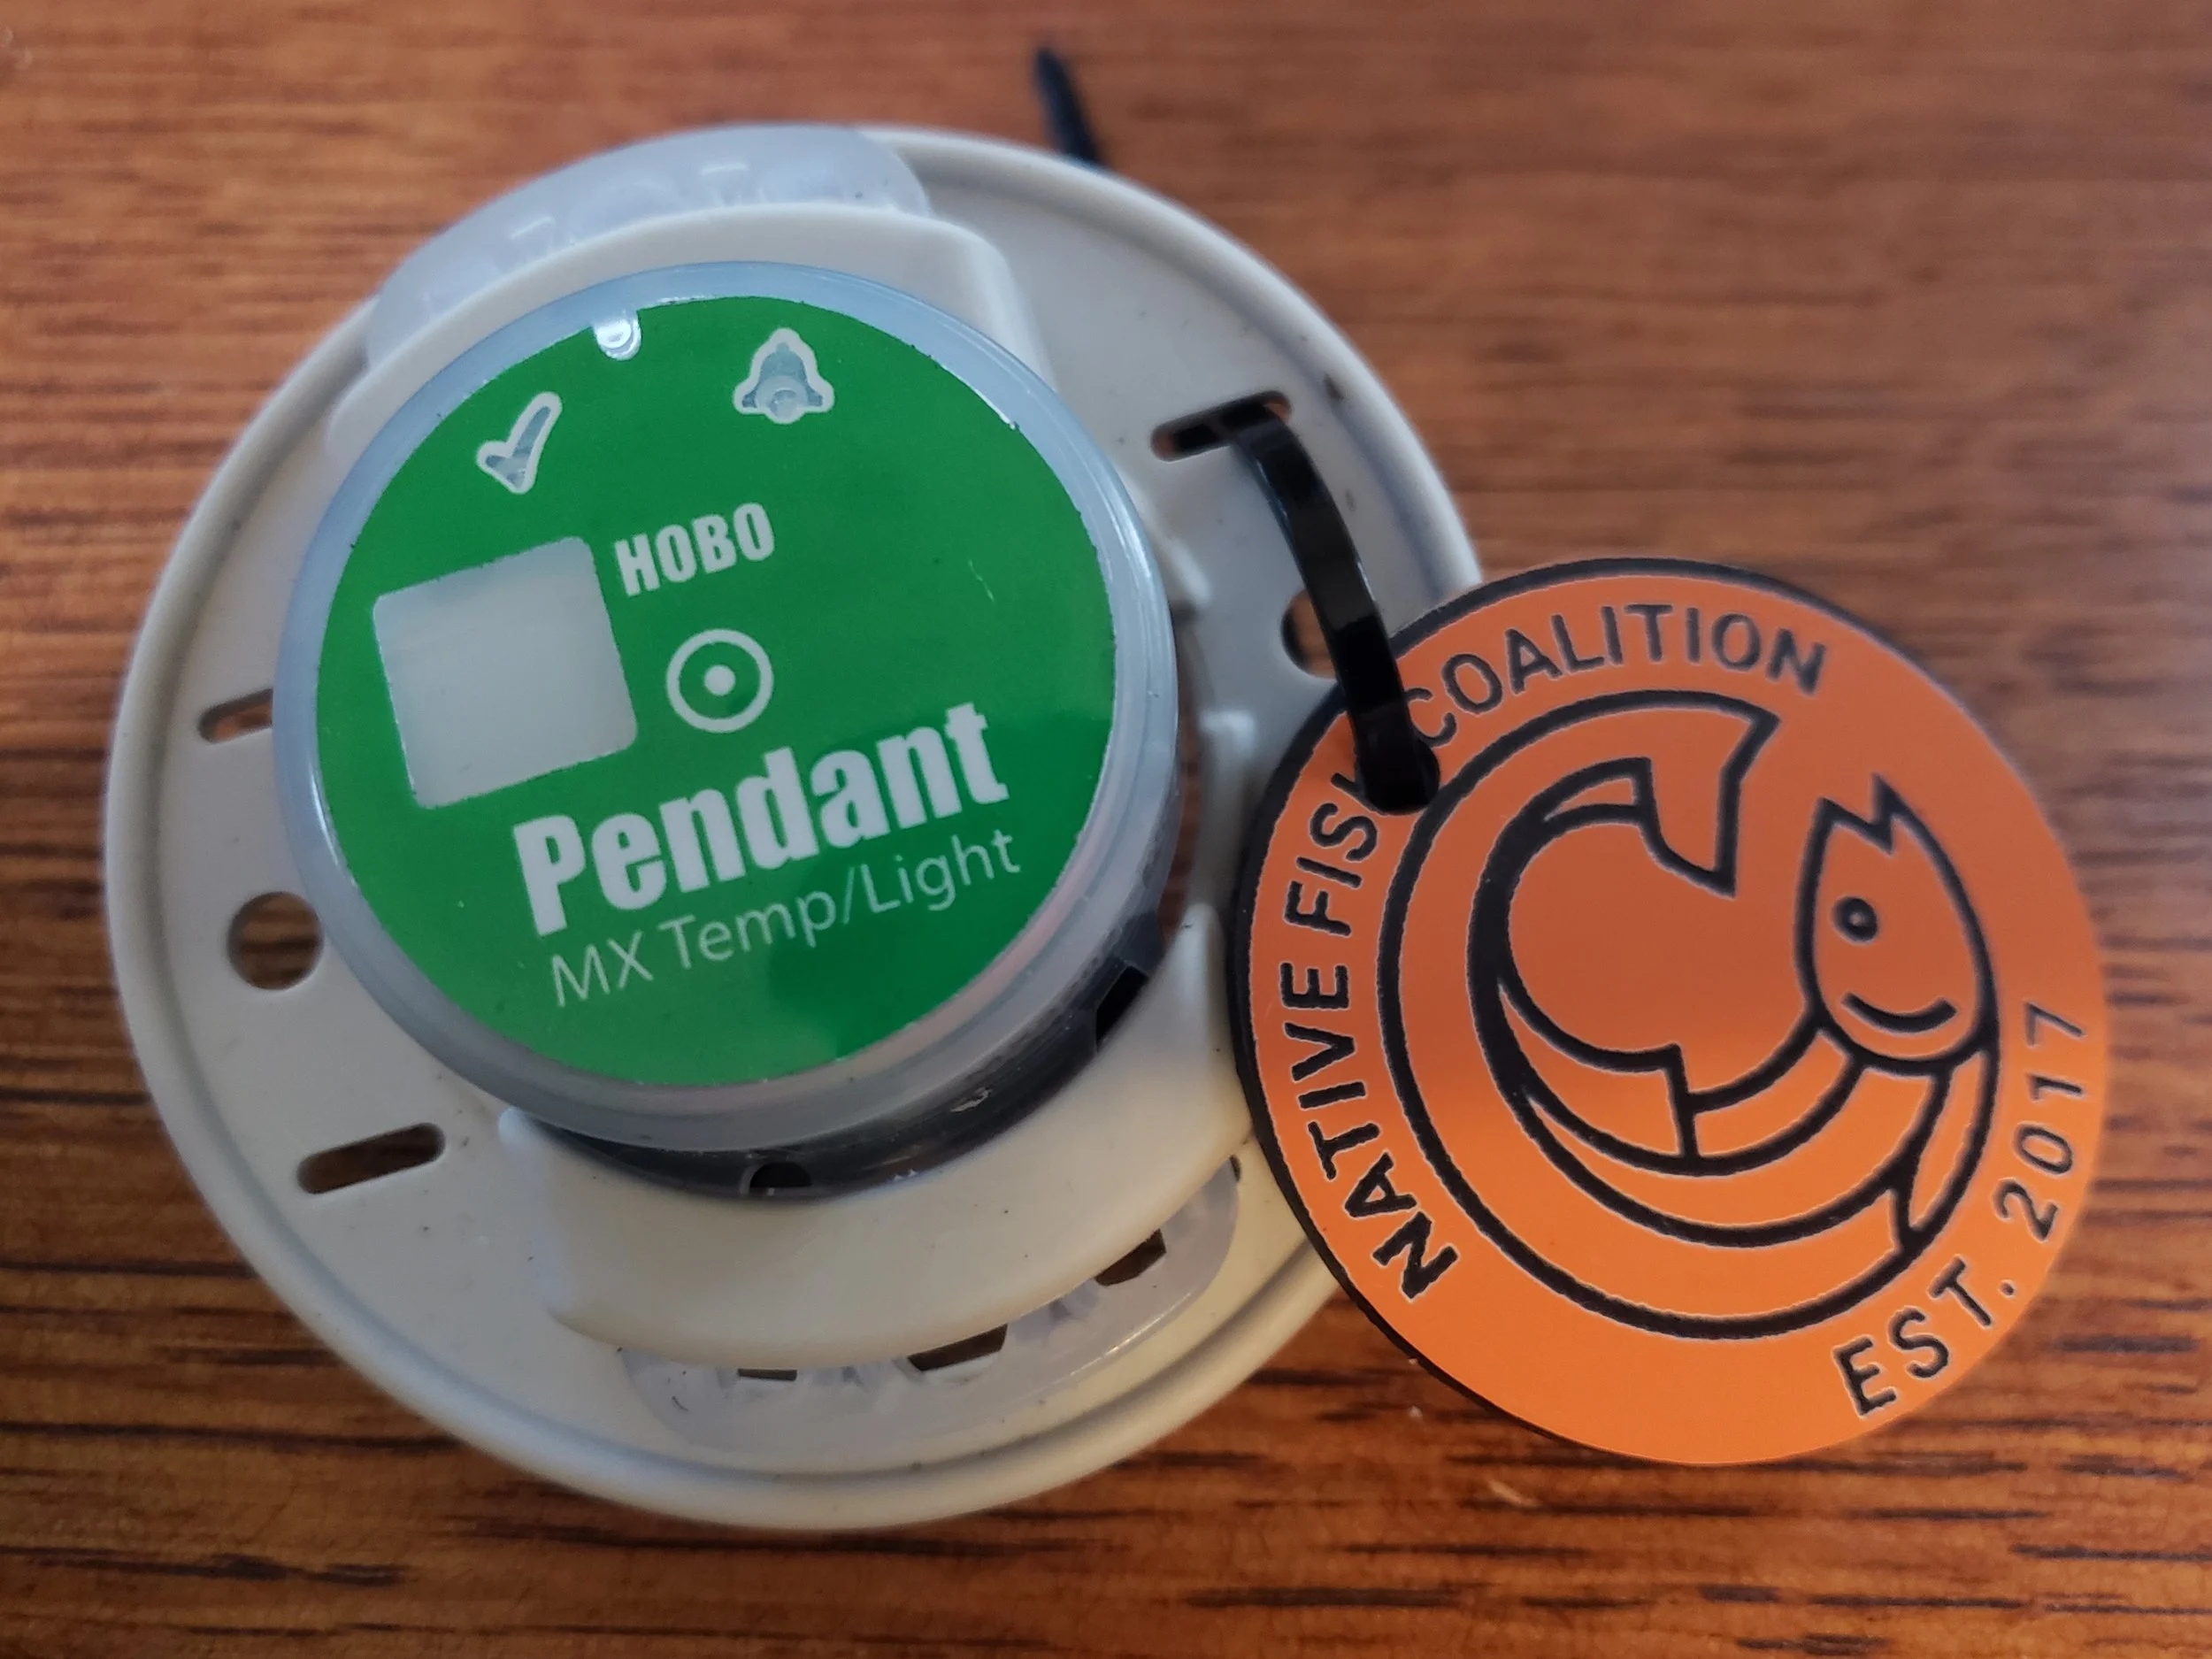
NFC has approved three types of data loggers, all made by Onset. The three options can record temperature only, temperature and light penetration, and temperature and dryness. Each increase in functionality adds some level of cost and financial exposure as units are occasionally lost, stolen, and vandalized. Always use the least amount of functionality needed to do the job. Special logger requests much be approved by National NFC in advance.
Recording Frequency
The more frequently you record data, the harder it is to work with and the busier your graphs for analysis and presenting your findings will be. NFC believes that 1-hour recording intervals are more than sufficient. If you wish to record more frequently, or less frequently, please seek approval from National NFC prior to deployment.
Temperature Setting
NFC’s primary audience is the public. Many do not understand Celsius. In fairness, and so as not to appear to be talking over anyone’s head, loggers should be set to record in Fahrenheit so we can report the results in a manner that everyone will understand.
Deployment Strategy
Where you deploy your data loggers will impact whether you get what you need in a single season. If insufficient you may have to do it over again:
Loggers should be deployed at the upstream and downstream ends of the area to be monitored.
Immediately upstream and downstream of impounded water.
Manmade dams, beaver dams, natural ponds, and natural wide area.
Immediately upstream and downstream of tributaries.
Immediately upstream and downstream of obvious spring contributions.
Deployment Guidelines
When you deploy and remove your data loggers will help with reporting:
All data loggers associated with a project should be deployed on the same day and at the beginning of a month for reporting consistency.
All data loggers should be removed at the end of a month for reporting consistency.
Physical Deployment
How you deploy your data loggers can lessen the likelihood they will be lost, damaged, vandalized, or stolen:
You must get landowner permission to deploy loggers.
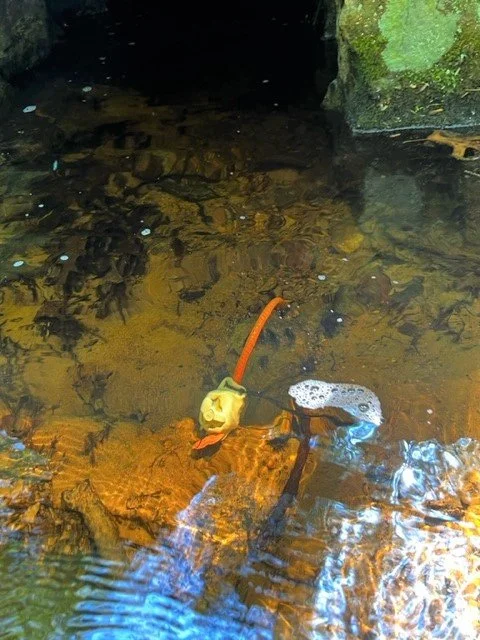
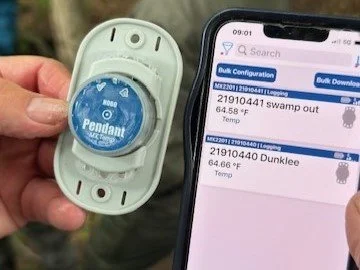
All data loggers must be equipped with an NFC tag for identification.
National NFC will provide tags on request.
We have replaced the round hard plastic tag with a pliable rubber keychain tag due to durability issues (fading and cracking). Please remove the O-ring before securing to logger.
Tags should be attached using small zip-ties.
The location of each logger should be recorded with a GPS pin for locating, downloading, maintenance, and retrieval.
Data loggers should be deployed in the deepest water available at the location to avoid going dry during low water periods.
Setting loggers behind rocks helps protect them from high water and debris.
Data loggers can be deployed using the following:
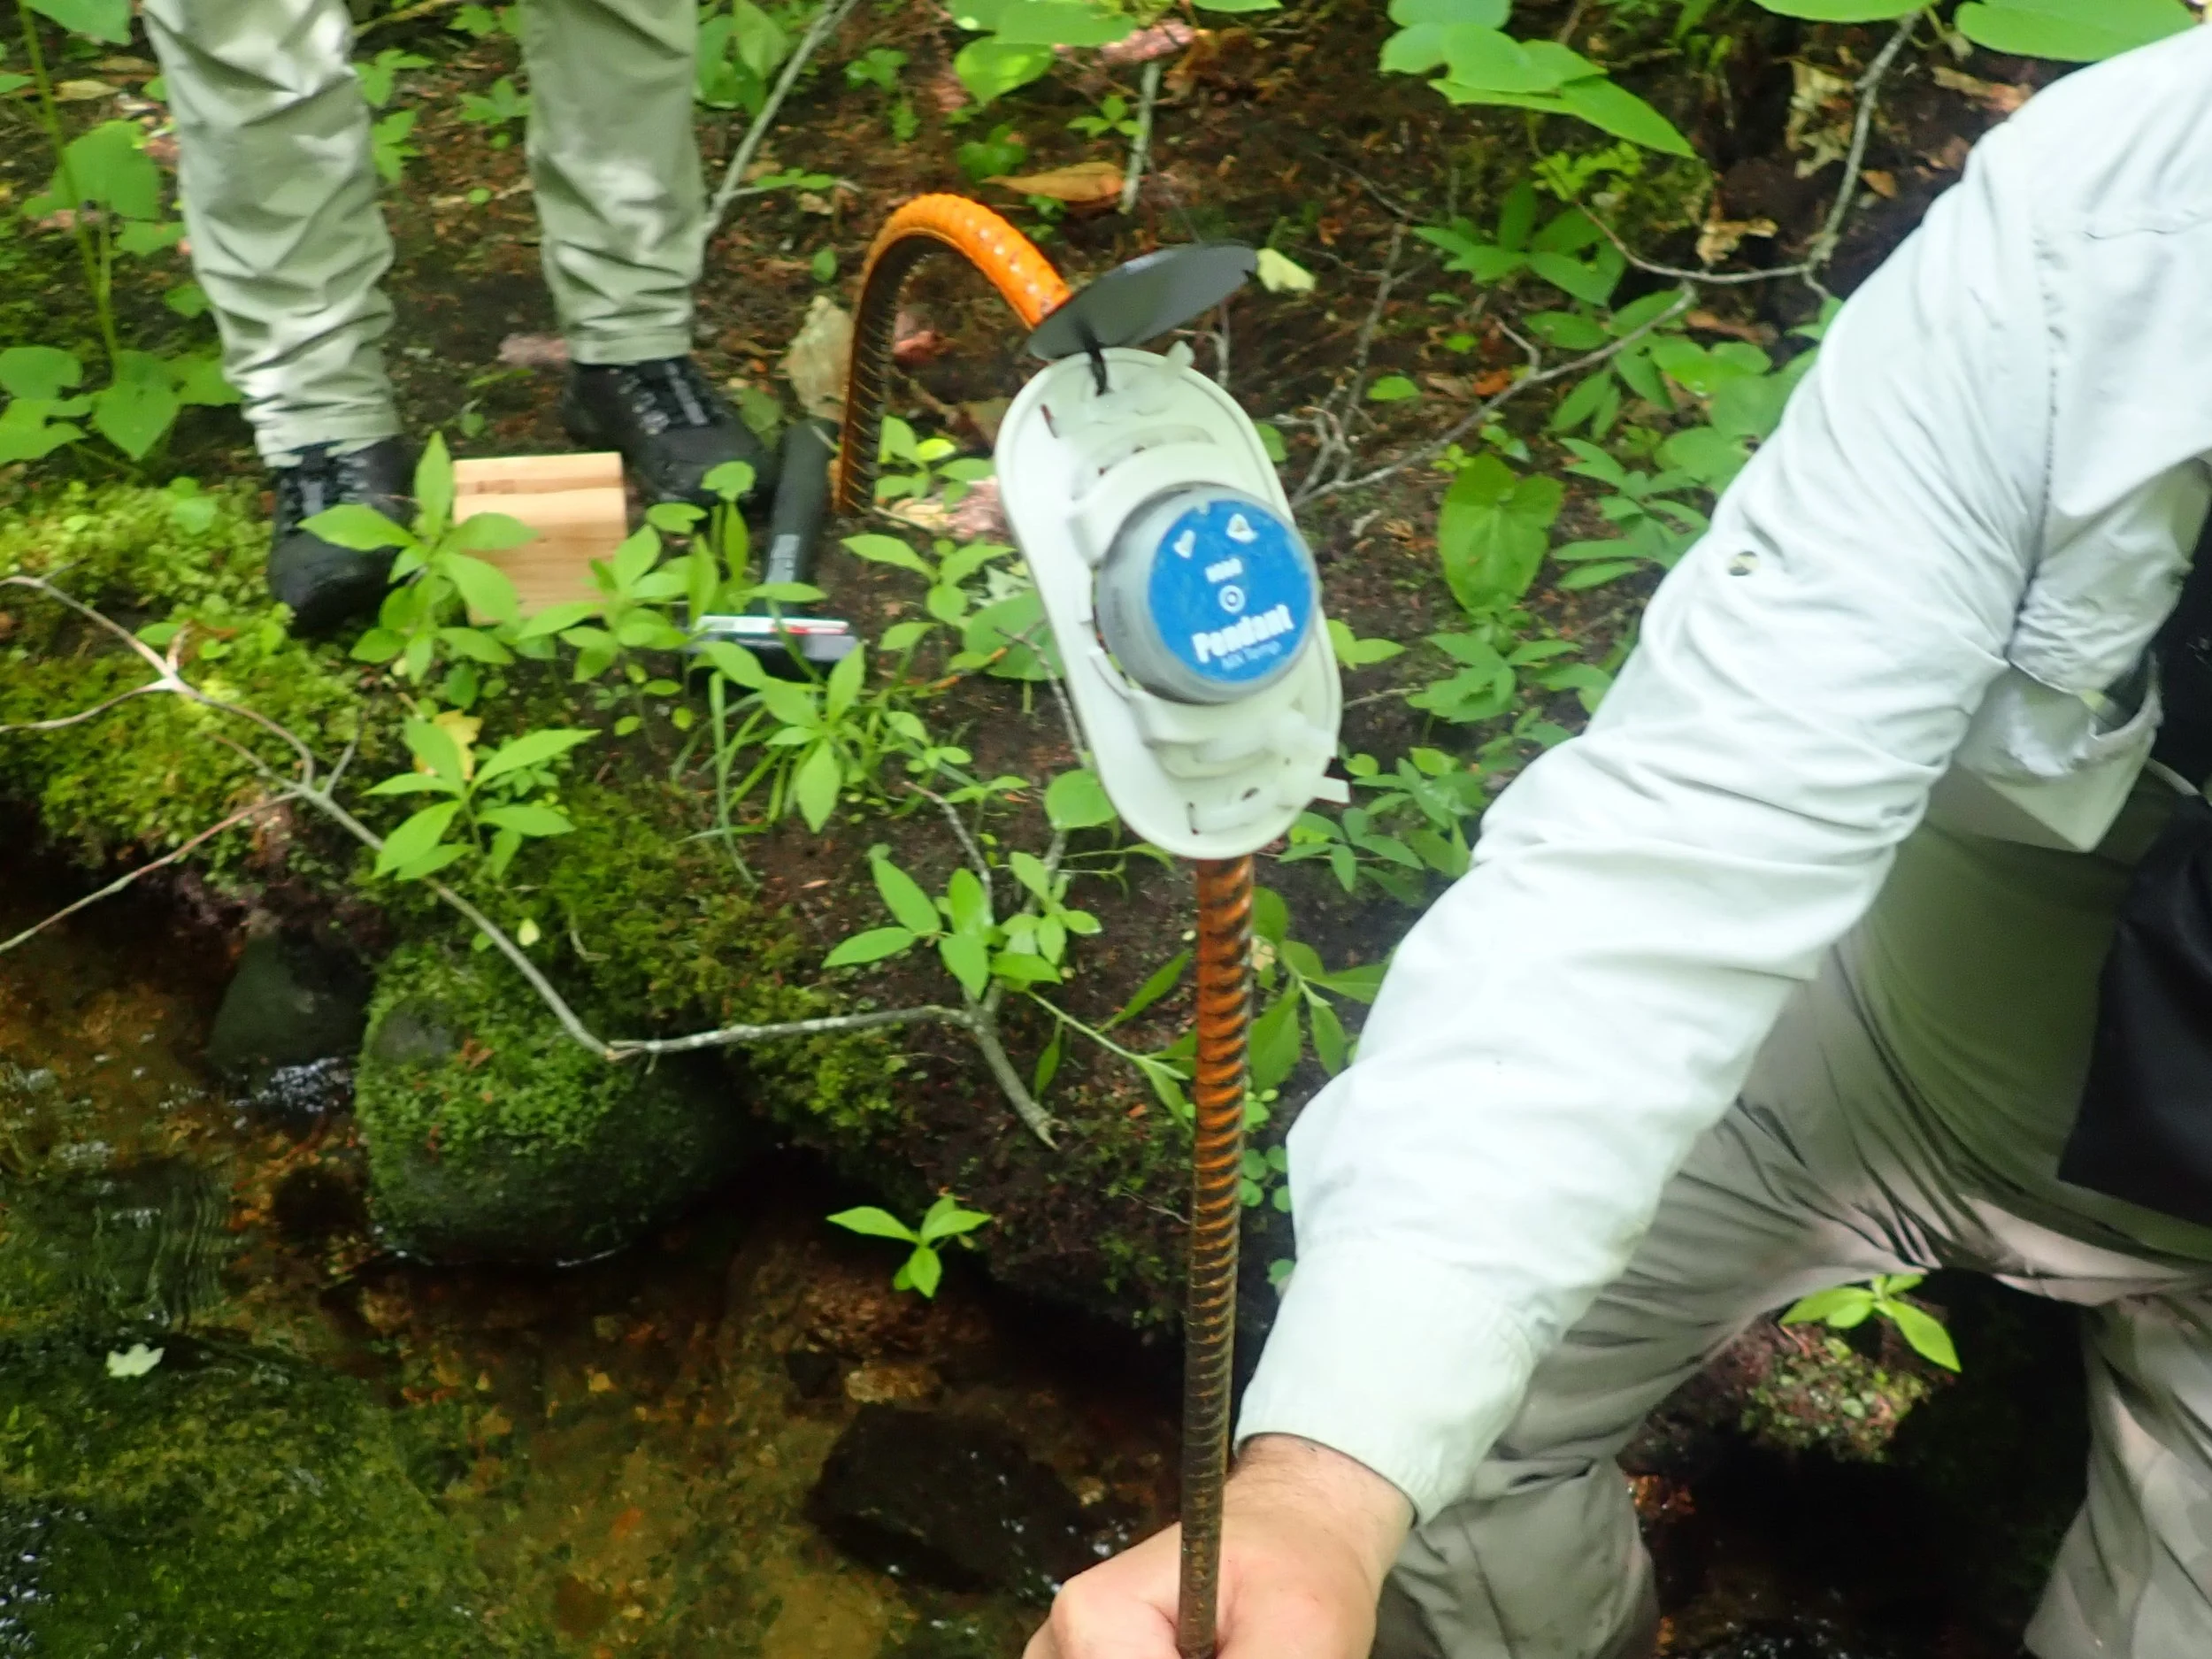
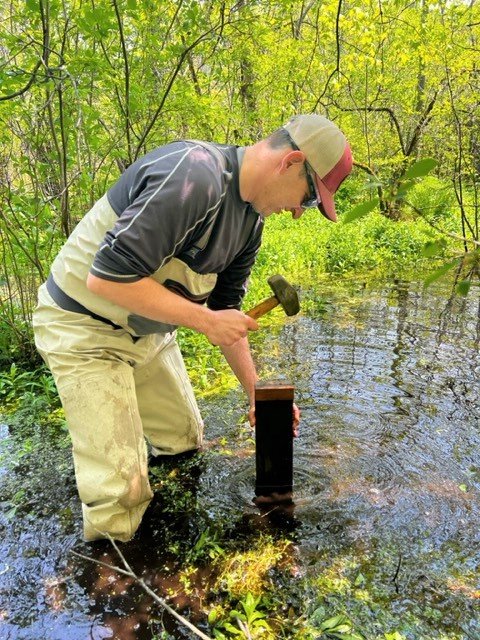
Straight or bent rebar pounded into the substrate.
NFC believes that rebar is the most secure means of logger deployment, especially during high water events.
Rebar should have a wing screw, wingnut and bolt, or removable metal or plastic cap on the top end to prevent loggers from being lost.
Cinderblocks or bricks (depending on conditions and expected flows).
Should be roped to shore if possible
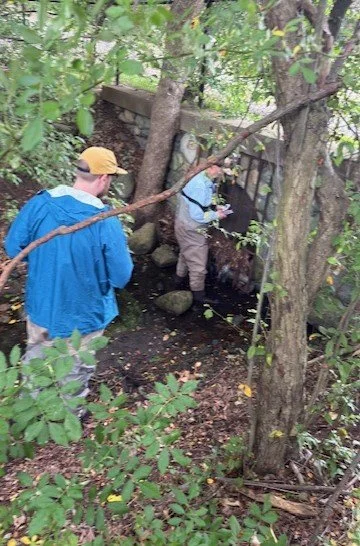
Storm grates and bridges.
Using zip ties or some other passive method.
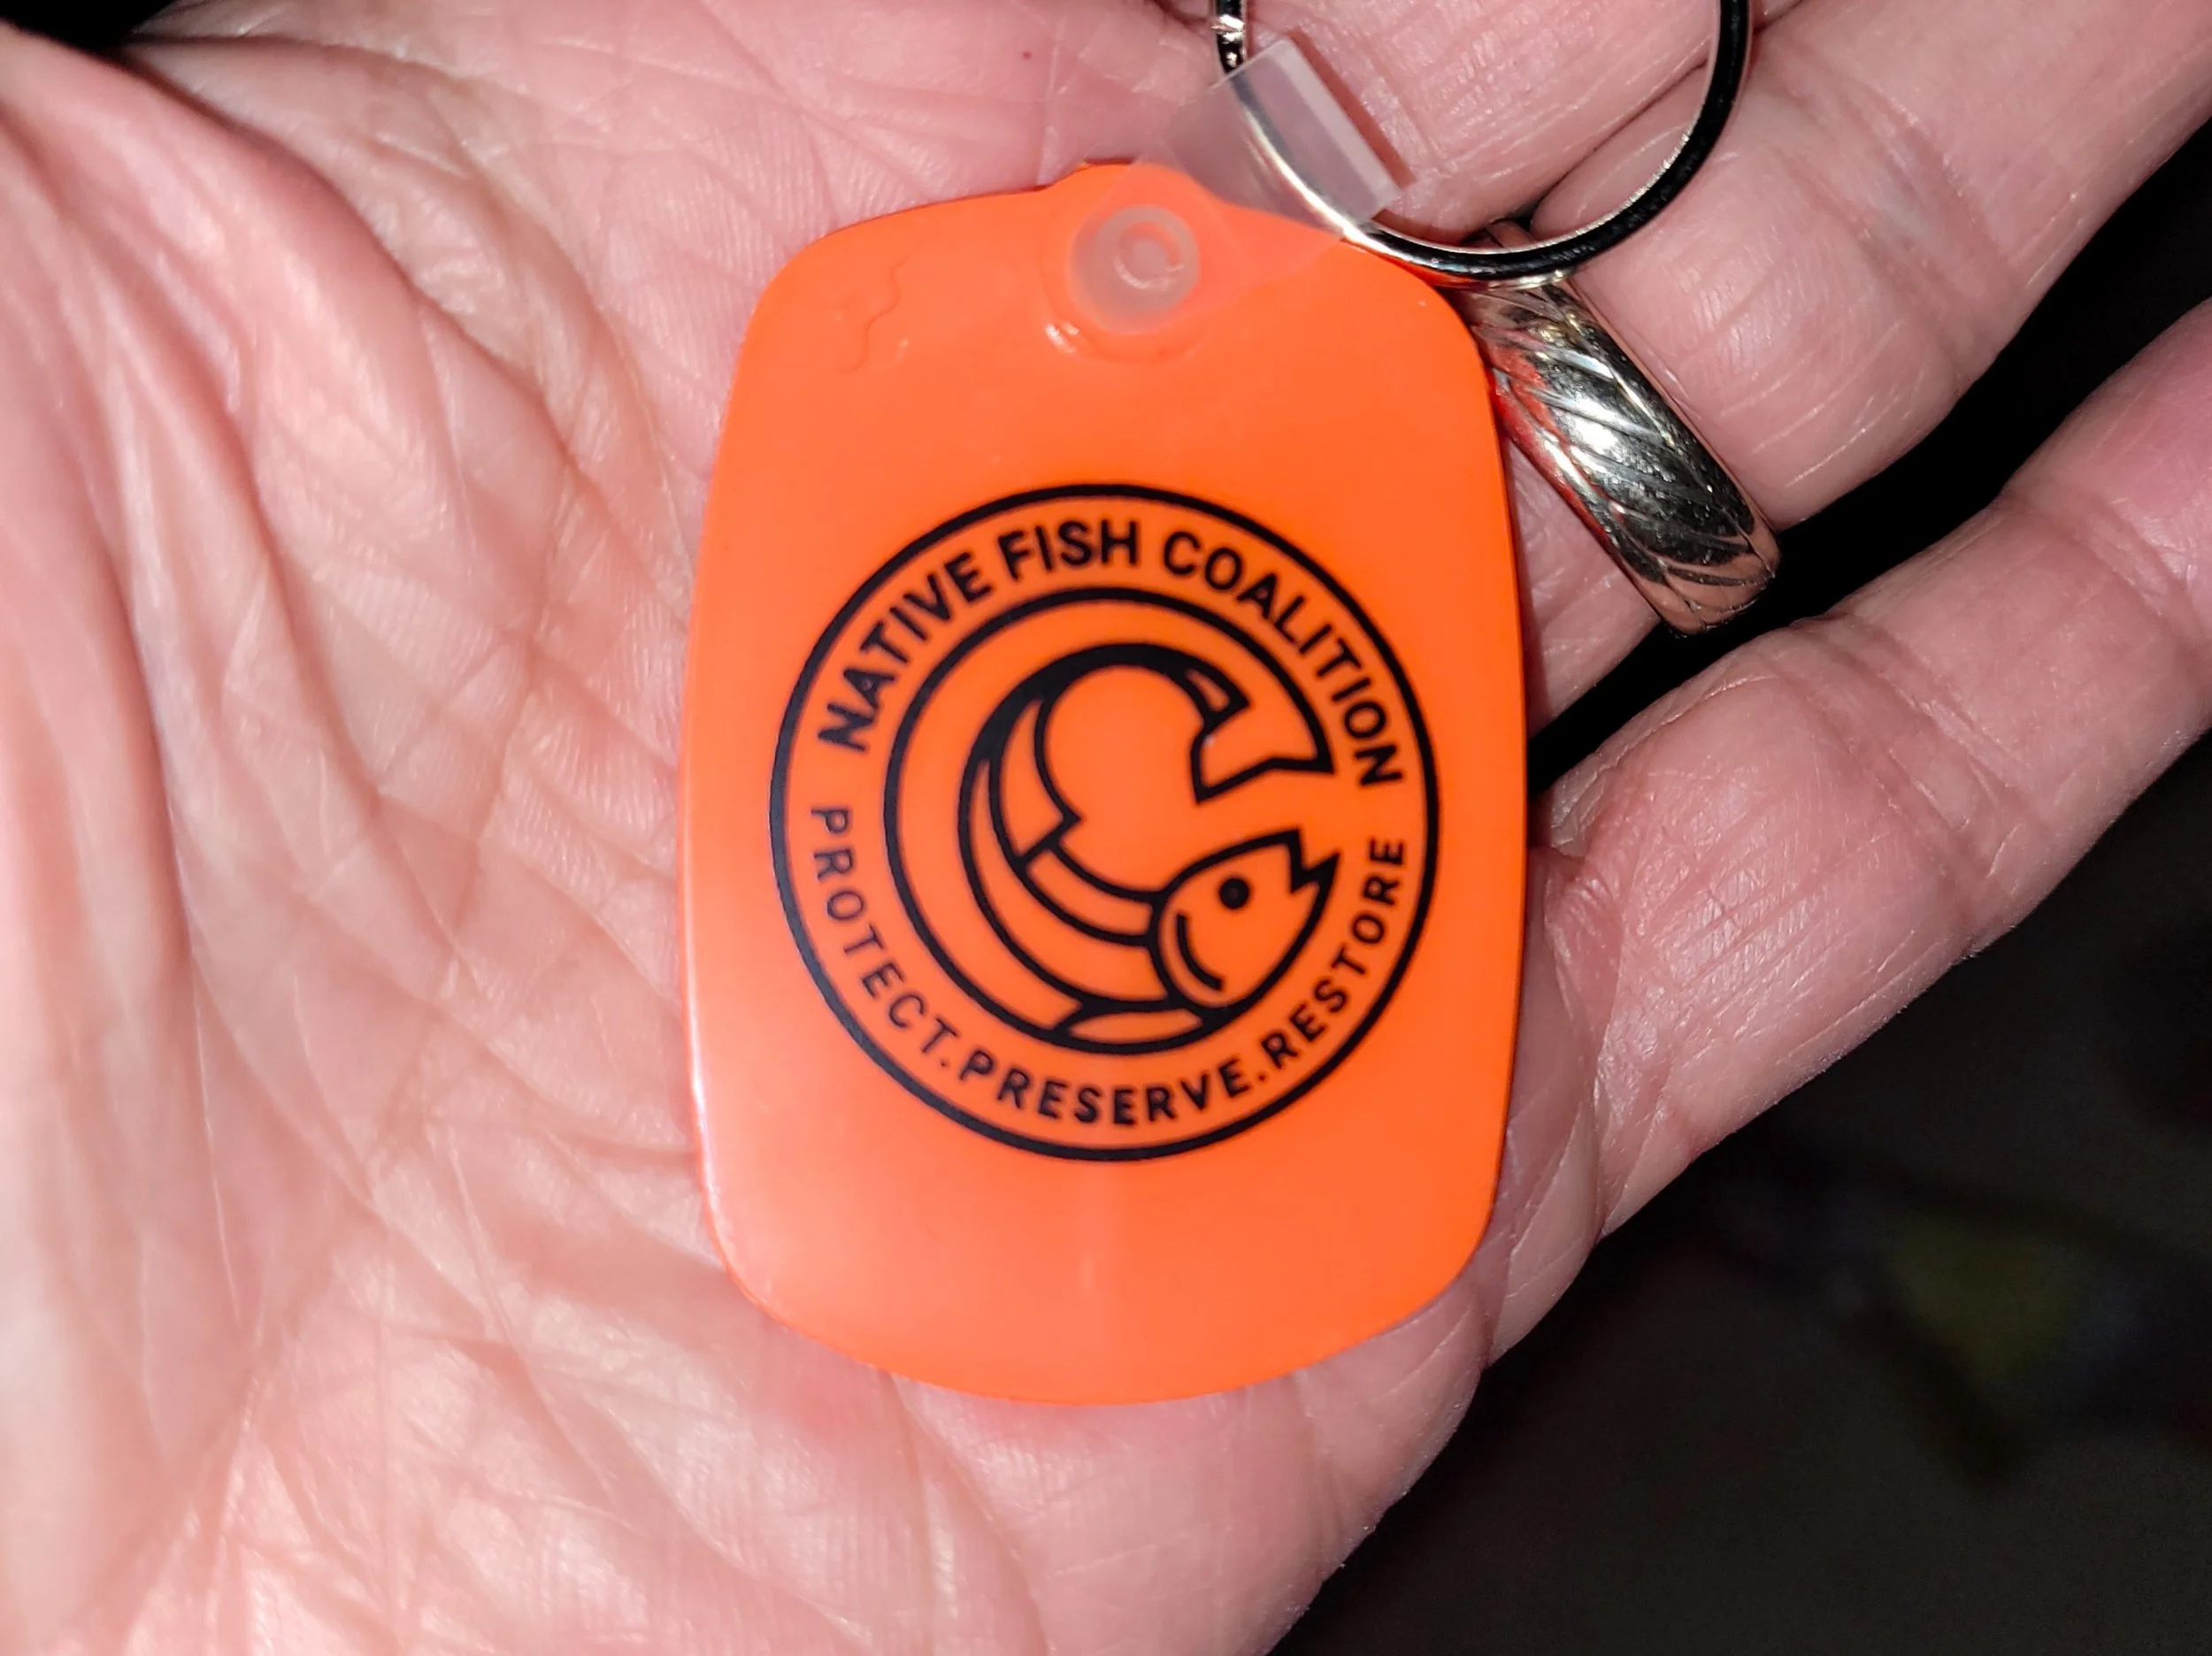
New soft rubber NFC logger tag…
Deployment Plan Approval
All data logger deployment project proposals must be approved by national NFC. Prior to approval, and before any funding is granted, all proposals must be accompanied by summary and detailed maps of the water to be monitored and a tentative deployment plan:
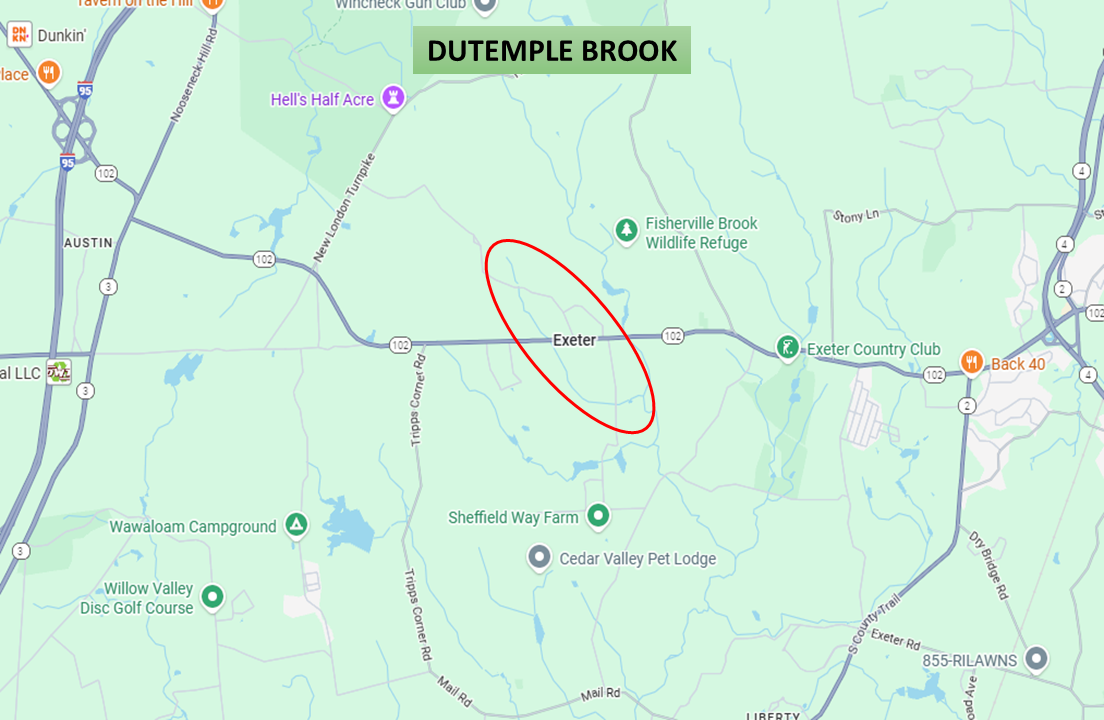
Maps can be created by screen scraping from Google Maps standard view – do not use the satellite view.
You will need to provide a summary level map that shows where the water is located in regard to easily identified towns, roads, etc.
Sample Summary Map:
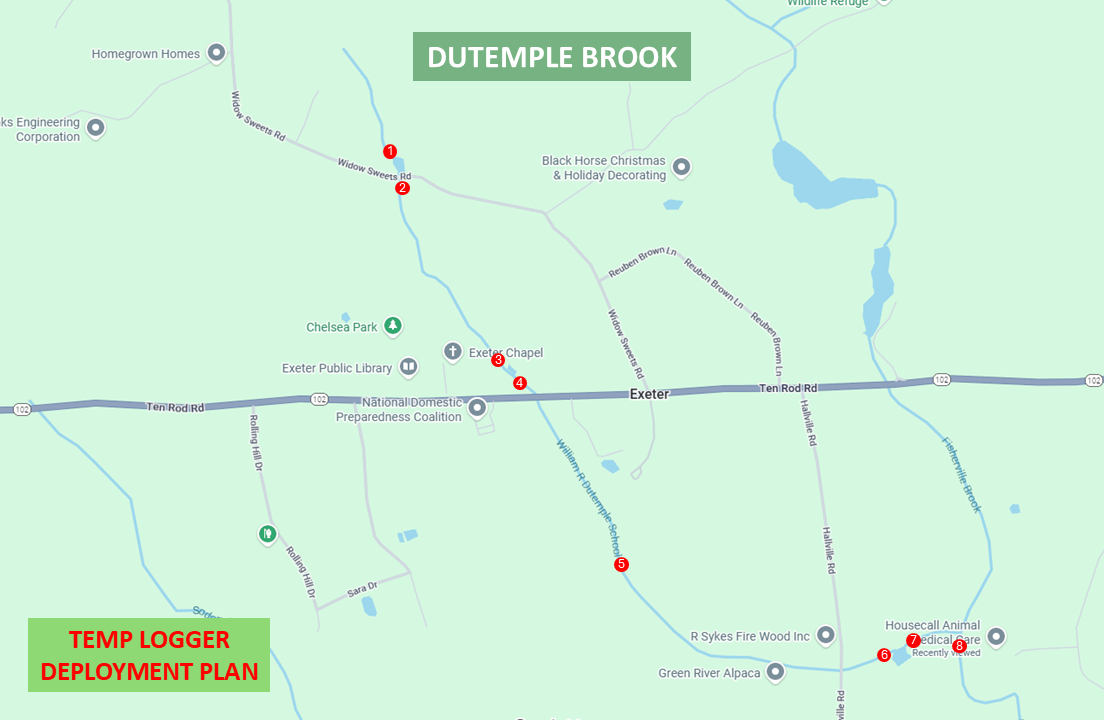
You will need to provide a detailed map that shows the survey area as well as where the individual loggers will be deployed.
Sample Detailed Map:
Data Download
Deployed data loggers can be lost or damaged during high water events and by floating debris. They can also be stolen, vandalized, damaged, and removal from the water by children and curious individuals. Batteries can run out as well. The longer a data logger sits between data downloads, the more data you will lose in the event of a problem. This results in incomplete datasets which negatively impact analysis and reporting.
Download bi-weekly to check status and prevent data loss.
Download to Excel spreadsheet.
Consolidate Excel files at end of project.
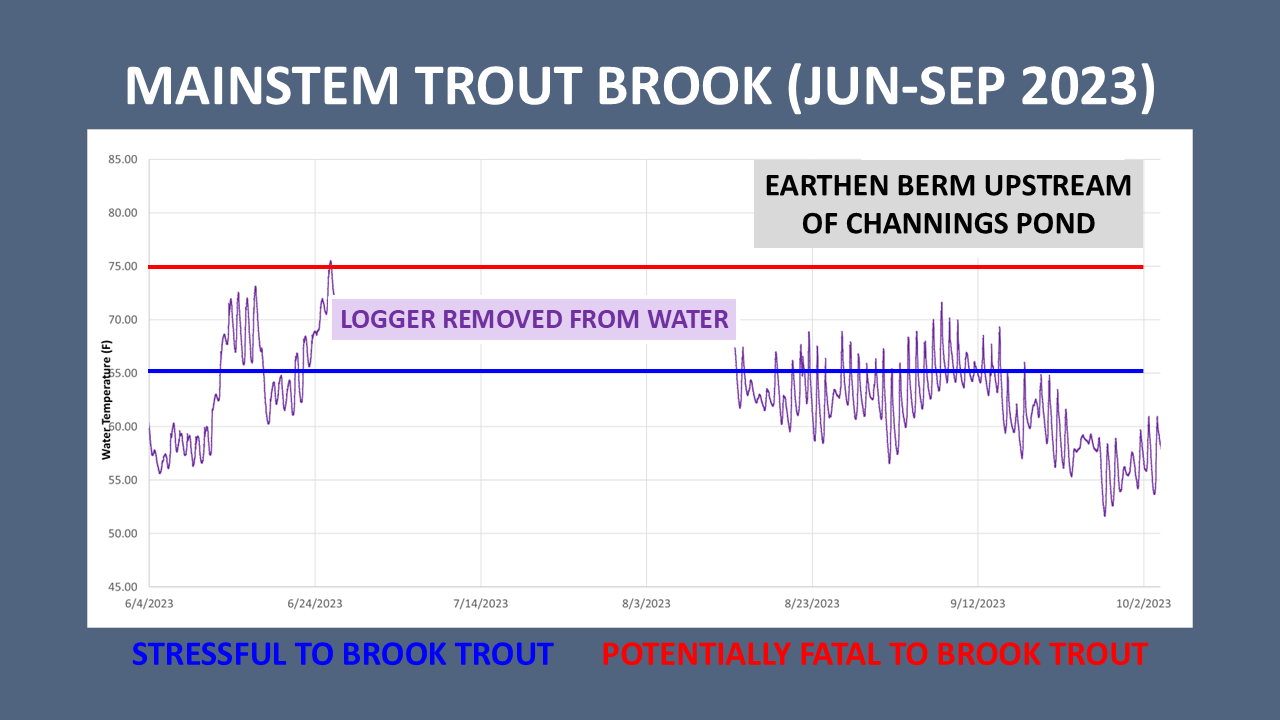
Below is an example of an incomplete dataset resulting from a logger being removed from the water by someone and left on dry land for 1.5 months. Unfortunately, as the trend line indicates this was the most critical period during the monitoring season. In a couple of other cases, chapters have had loggers lost or stolen resulting in the loss of an entire season of data.
Note that while the loggers are Bluetooth compatible, they must be removed from the water to download the data. It is important that you secure the logger to the deployment apparatus in a manner that allows for easy removal and reinstallation. Please note and report the date/time of removal for future reference as it will appear as a spike or drop in water temperature.
Reporting Requirements
At the end of the monitoring season, and at intervals if desired for blogging, national NFC will require graphs to include in the CAMPAIGN entry on our website and blogging for public dissemination. We would like the following graphs. They can be created using the HOBO logger app or Excel and inserted into a PowerPoint slide, or directly from PowerPoint:
Full season graphs for each logger.
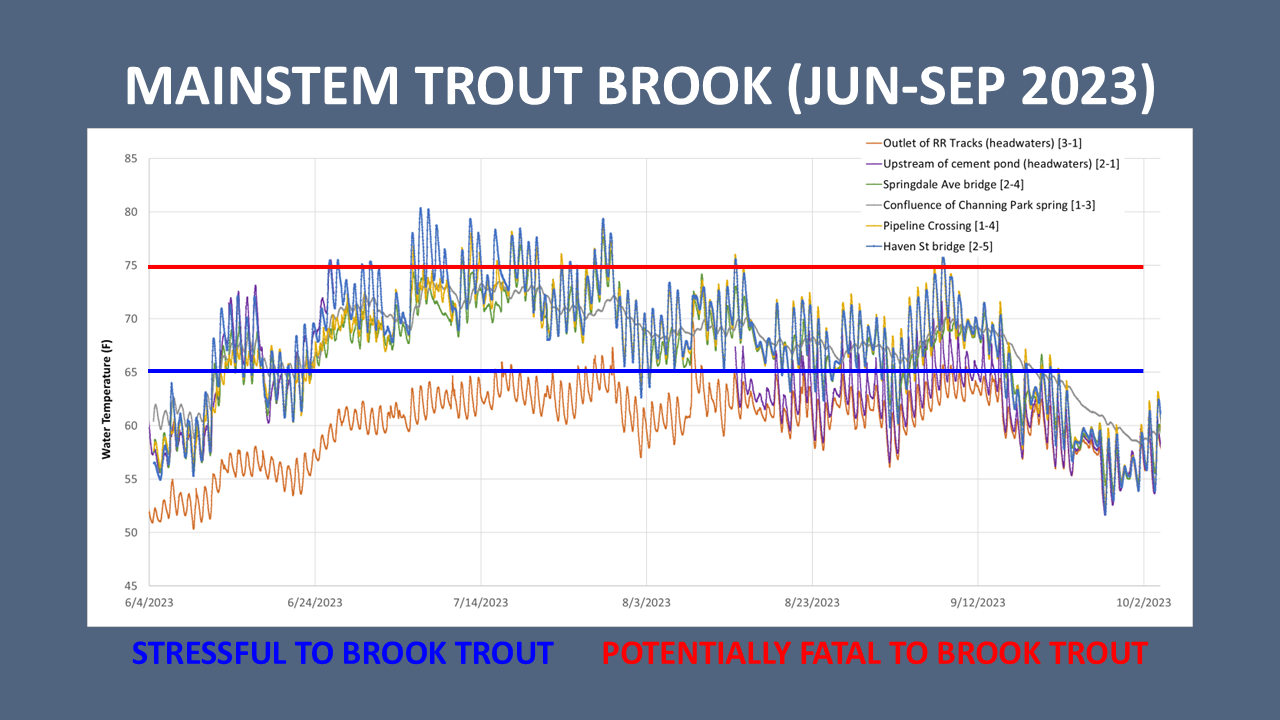
Full season graph for all loggers for the respective stream.
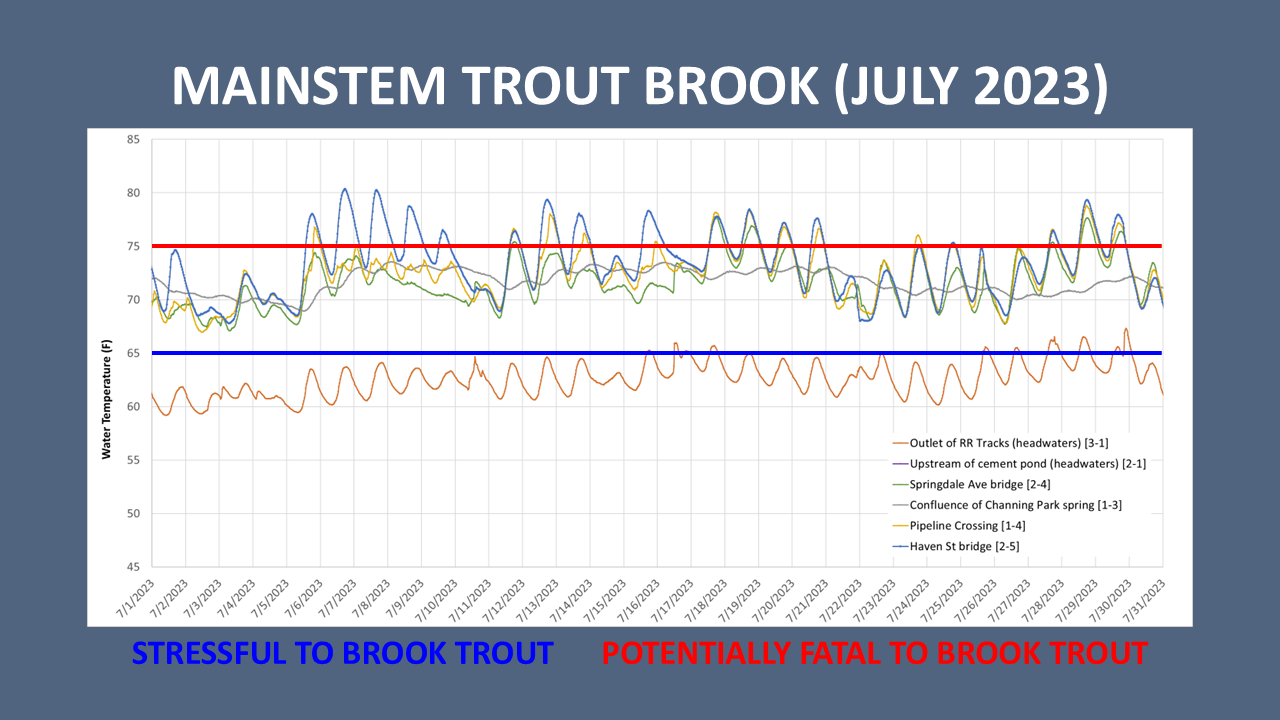
Single month graphs for all loggers for the respective stream.
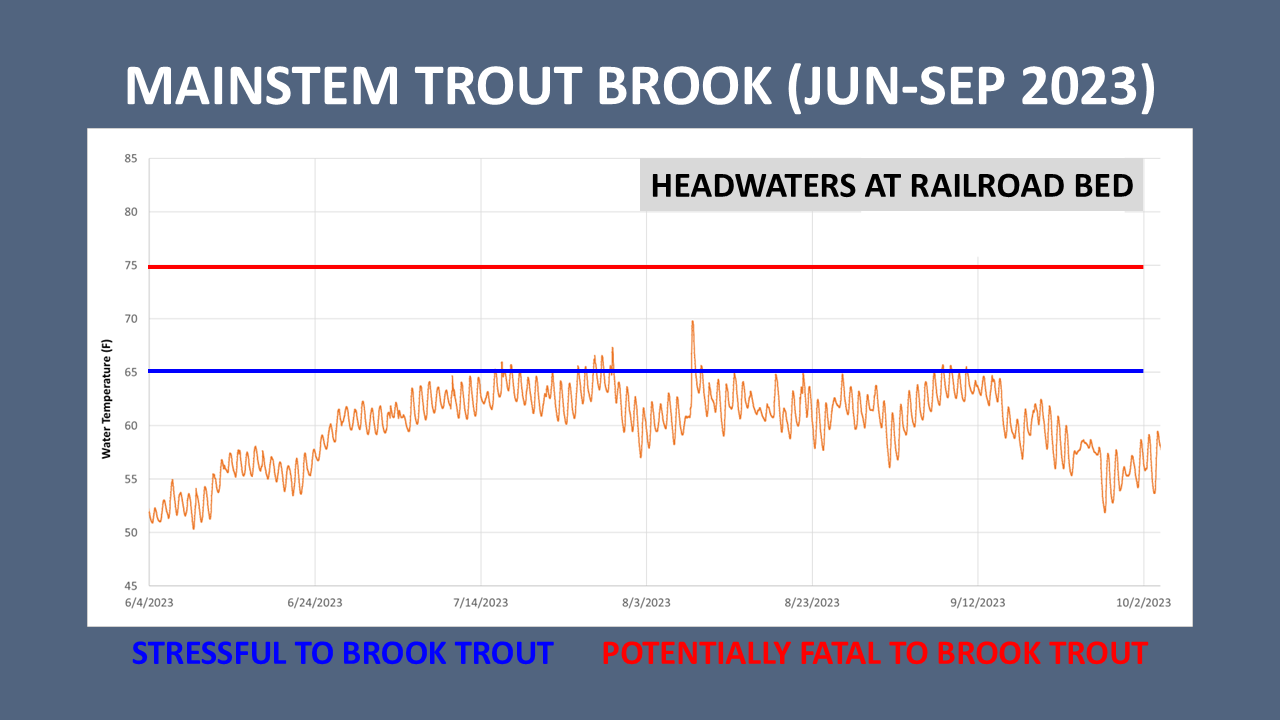
Sample Full Season Single-Logger Graph:
Sample Full Season Multi-Logger Graph:
Sample Single Month Multi-Logger Graph:
Logger Instructions:
If not already installed, install the HOBOconnect App on your phone/device. (https://www.onsetcomp.com/products/software/hoboconnect)
Open the app. Go to the “Devices” tab. You should see a screen that says “Scanning for Onset Gateways and Loggers”
Wake-up one or more loggers. Press and release the middle section of the logger (or the raised “Hobo” part of the housing for TidbiT MX Temp 400 models). The checkmark and the alarm icons will flash with LEDs (green in the checkmark and red in alarm) when the device wakes up for Bluetooth communication.
On the “Devices” tab in the app, you should see the list of loggers that are awake and connected.
Tap on a logger to open/connect in the app. (Note: you might need to wake-up the logger again if it does not make connection in the app. Also, sometimes it takes 10-30 seconds for a logger to connect to the app.)
Configuring a Logger:
Open the configuration screen (tap the “Customize Configuration and Start” button in the app.)
These are the recommended settings, but you can make adjustments if you have preferences for your situation:
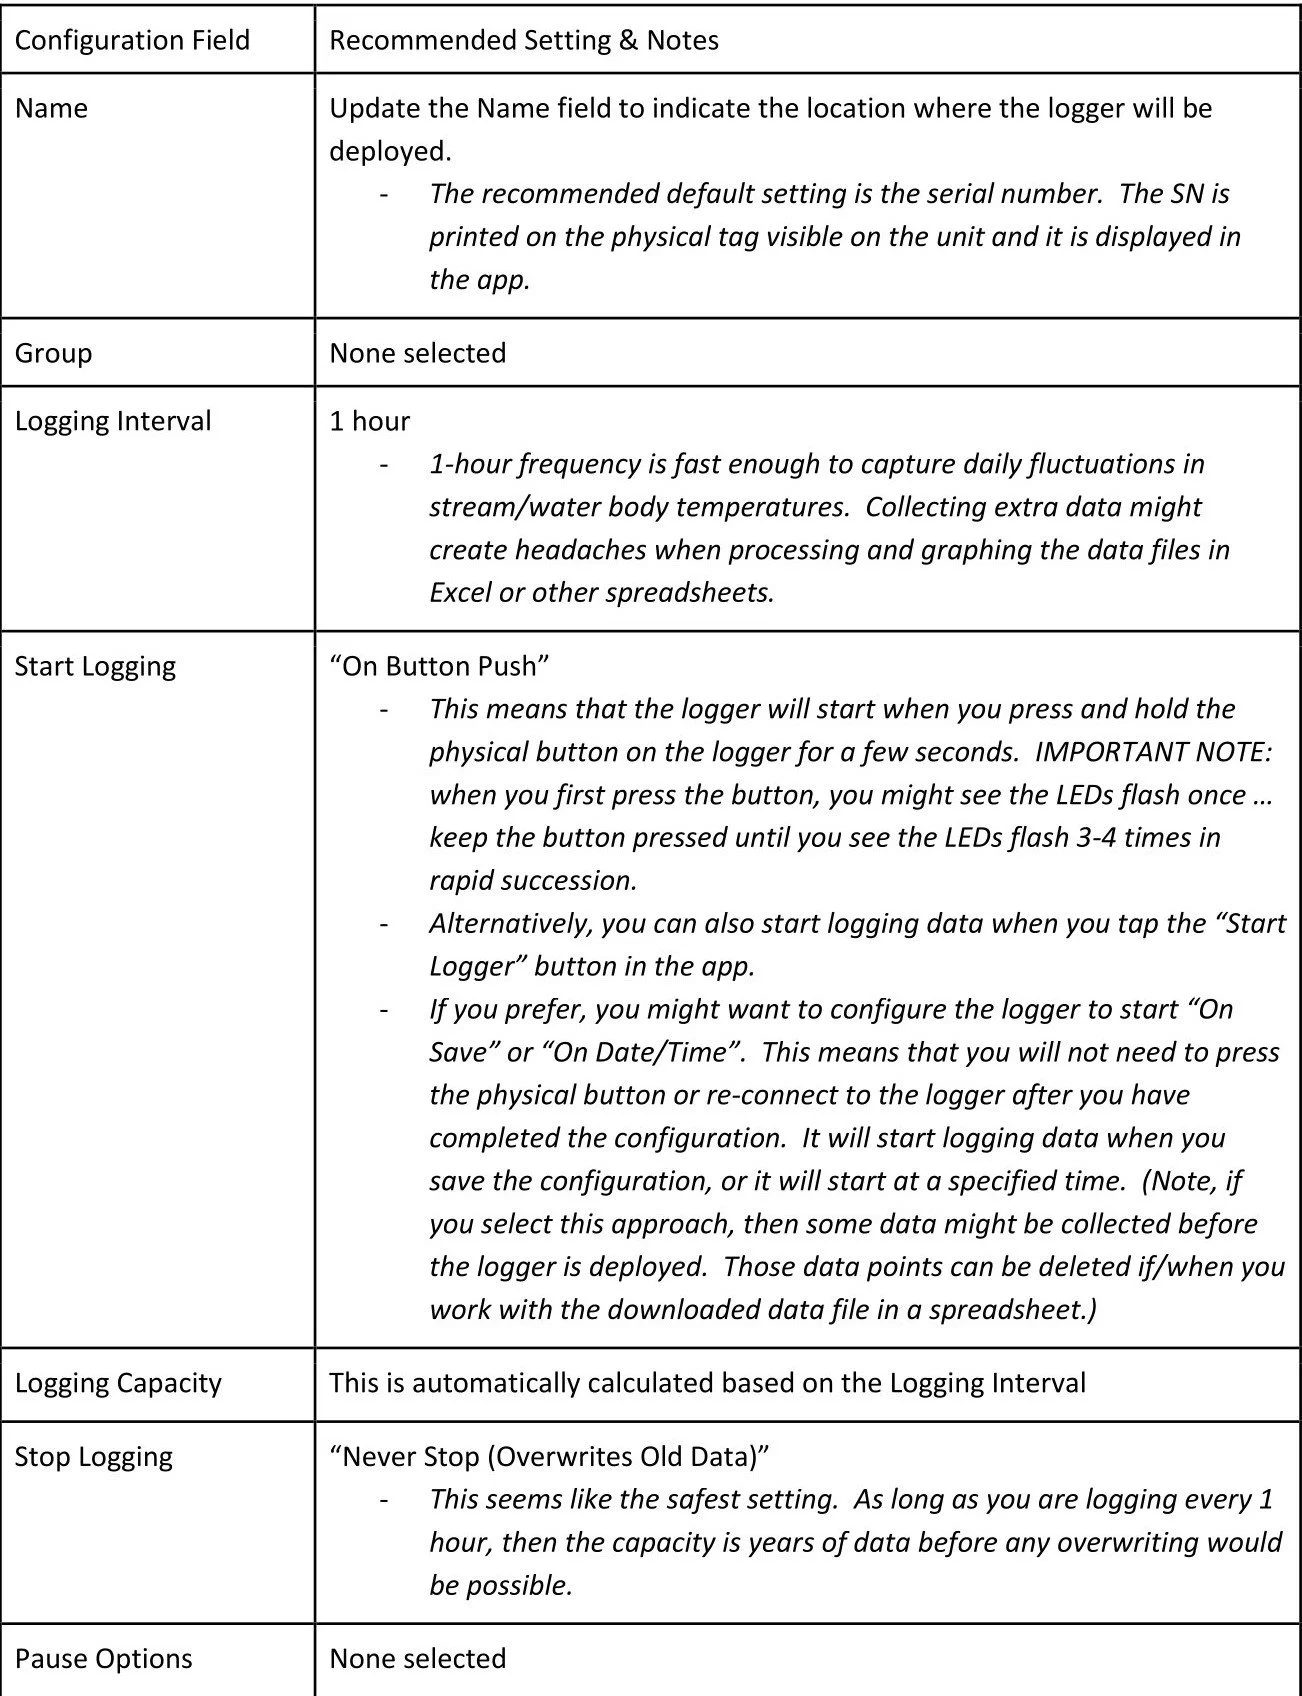
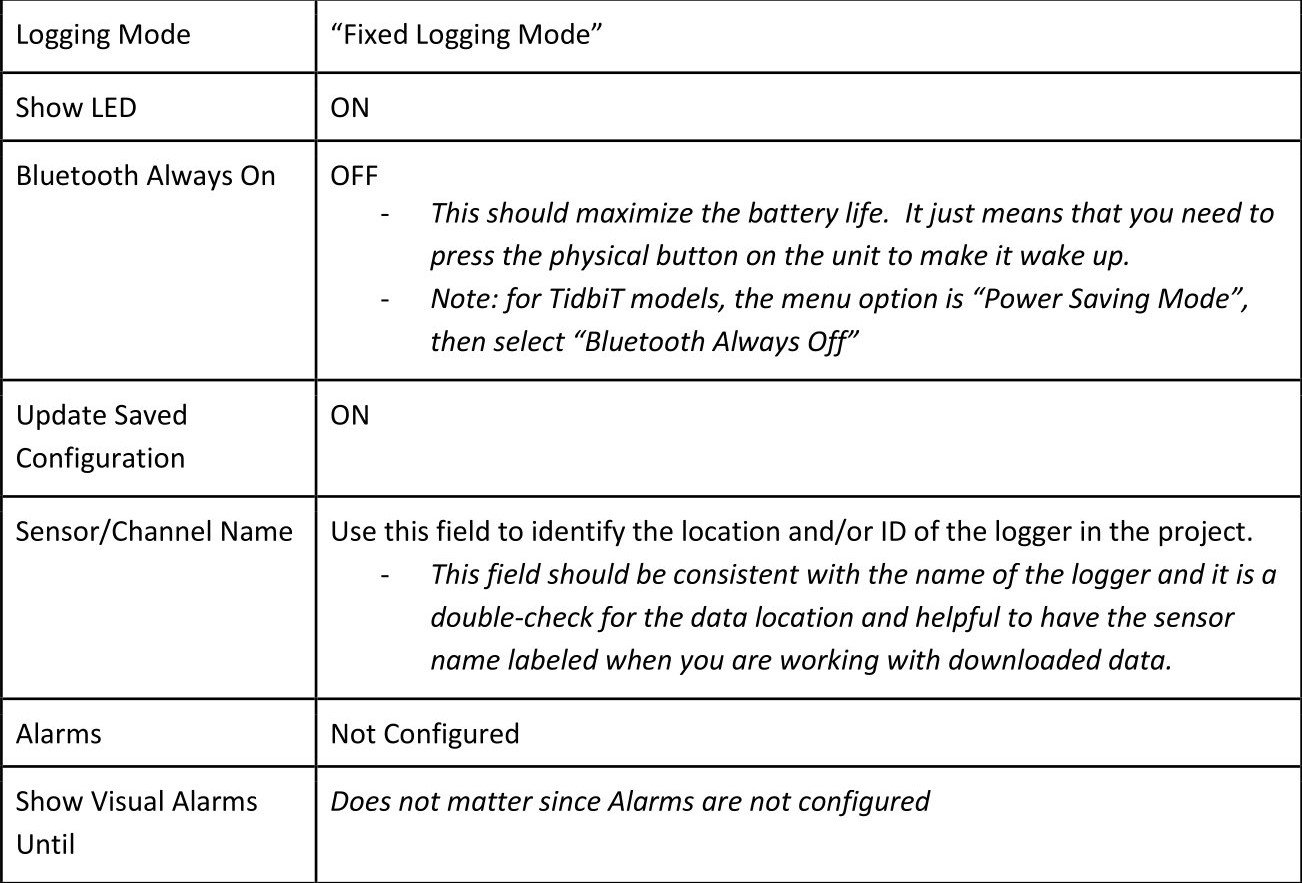
Once configuration is updated or confirmed, tap the “Start” button icon. You will get a message(s) about the logger being configured. Note: if you used the recommended settings, the logger is not yet collecting data because it is waiting for logging to be started with the physical button or the “Start Logger” button in the app.
Starting a Logger - Physical Button
The logger will start when you press and hold the physical button on the logger for a few seconds. IMPORTANT NOTE: when you first press the button, you might see the LEDs flash once … keep the button pressed until you see the LEDs flash 3-4 times in rapid succession.
After starting the logger, you should check the logger in the HOBOconnect app to confirm that the status is “Logging” (not “Awaiting Button Start”). Note: sometimes it takes 30-60 seconds for the status to refresh in the Devices tab of the app.
Starting a Logger - Using the HOBOconnect app
Open the HOBOconnect app and wake-up the logger.
Tap the logger name to connect to the logger.
Tap the “Start Logger” button in the app. Once tapped and the logger has started, the button in the app will switch to become a “Stop Logger” button.
Downloading Data:
Open the HOBOconnect app and wake-up the logger.
Tap the logger name to connect to the logger.
Tap the “Download Data” button in the app.
Note: the logger is continuing to log data. So, you can use this procedure to download data, but then replace the logger in the sampling location and continue to collect new data.
Once download is complete, you can “Export & Share”. This will allow you to send a .csv file by email or text message. If you don’t Export & Share, the downloaded data file will still be available on your device.
Stopping and Re-setting a Logger (once a project is complete):
Open the HOBOconnect app and wake-up the logger.
Tap the logger name to connect to the logger.
Tap the “Stop Logger” button in the app.
Tap the “Download Data” button in the app.
Tap “Customize Configuration & Start”.
Restore the Name to the Serial Number.
Delete the text in the Temperature Sensor/Channel Name field(s).
Update any other settings to the recommended defaults.